


Annual statistics
Development of the banks’ financial situation over the last years
Situation as at 31 December 2023
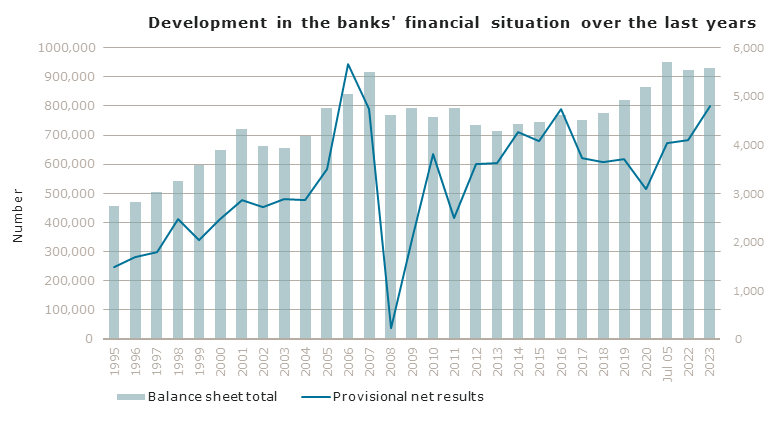
| Period |
Number of banks |
Balance sheet totals
(in million EUR) |
Net result (in million EUR) |
| 1994 |
222 |
433,352 |
1,454 |
| 1995 |
220 |
455,482 |
1,481 |
| 1996 |
221 |
471,704 |
1,689 |
| 1997 |
215 |
505,865 |
1,782 |
| 1998 |
209 |
540,887 |
2,476 |
| 1999 |
210 |
598,006 |
2,030 |
| 2000 |
202 |
647,633 |
2,479 |
| 2001 |
189 |
721,978 |
2,861 |
| 2002 |
177 |
662,700 |
2,720 |
| 2003 |
169 |
655,601 |
2,874 |
| 2004 |
162 |
695,363 |
2,866 |
| 2005 |
155 |
791,250 |
3,498 |
| 2006 |
156 |
839,574 |
5,671 |
| 2007 |
156 |
915,341 |
4,739 |
| 2008 |
152 |
929,454 |
218 |
| 2009 |
149 |
792,538 |
2,056 |
| 2010 |
147 |
762,315 |
3,817 |
| 2011 |
143 |
792,888 |
2,490 |
| 2012 |
141 |
734,768 |
3,597 |
| 2013 |
147 |
713,378 |
3,631 |
| 2014 |
144 |
737,212 |
4,253 |
| 2015 |
143 |
743,154 |
4,070 |
| 2016 |
141 |
769,982 |
4,740 |
| 2017 |
140 |
751,902 |
3,788 |
| 2018 |
135 |
774,911 |
3,654 |
| 2019 |
127 |
821,723 |
3,703 |
| 2020 |
128 |
863,368 |
3,091 |
| 2021 |
124 |
951,052 |
4,021 |
| 2022 |
121 |
923,030 |
3,947 |
| 2023 |
119 |
929,007 |
6,603 |
All statistics: link to the “Statistics” page