


Annual statistics
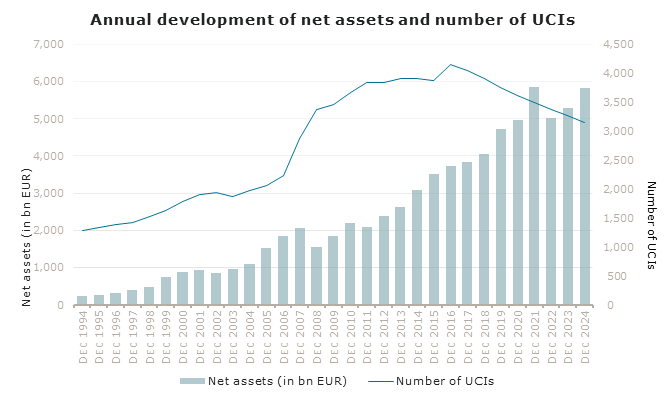
Development of net assets and number of UCIs
Situation as at 31 December 2023
| Period | Net assets (in bn EUR) |
Number of UCIs | Registrations on the list | Deregistrations from the list | Net subscriptions by period (in bn EUR) |
| 1990 | 72.2 | 805 | 192 | 38 | n.a. |
| 1991 | 103.0 | 898 | 152 | 59 | + 23.7 |
| 1992 | 167.4 | 1,041 | 209 | 66 | + 57.5 |
| 1993 | 247.1 | 1,175 | 195 | 61 | + 47.7 |
| 1994 | 247.1 | 1,283 | 200 | 92 | + 23.8 |
| 1995 | 261.8 | 1,329 | 166 | 120 | + 2.0 |
| 1996 | 308.6 | 1,384 | 182 | 127 | + 22.5 |
| 1997 | 391.8 | 1,426 | 193 | 151 | + 50.1 |
| 1998 | 486.8 | 1,521 | 234 | 139 | + 84.1 |
| 1999 | 734.5 | 1,630 | 265 | 156 | + 140.1 |
| 2000 | 874.6 | 1,785 | 278 | 123 | + 168.1 |
| 2001 | 928.4 | 1,908 | 299 | 176 | + 121.7 |
| 2002 | 844.5 | 1,941 | 222 | 189 | + 57.3 |
| 2003 | 953.3 | 1,870 | 175 | 246 | + 82.6 |
| 2004 | 1,106.2 | 1,968 | 202 | 104 | + 113.7 |
| 2005 | 1,525.2 | 2,060 | 266 | 174 | + 236.3 |
| 2006 | 1,844.8 | 2,238 | 345 | 167 | + 241.3 |
| 2007 | 2,059.4 | 2,868 | 824 | 194 | + 188.5 |
| 2008 | 1,559.7 | 3,371 | 712 | 209 | – 77.2 |
| 2009 | 1,840.9 | 3,463 | 408 | 316 | + 84.4 |
| 2010 | 2,198.9 | 3,667 | 471 | 267 | + 161.6 |
| 2011 | 2,096.5 | 3,845 | 469 | 291 | + 5.3 |
| 2012 | 2,383.8 | 3,841 | 381 | 385 | +123.1 |
| 2013 | 2,615.4 | 3,902 | 362 | 301 | + 193.6 |
| 2014 | 3,095.0 | 3,905 | 350 | 347 | + 249.0 |
| 2015 | 3,506.2 | 3,878 | 262 | 289 | + 298.0 |
| 2016 | 3,741.3 | 4,144 | 296 | 311 | +99.6 |
| 2017 | 4,159.6 | 4,044 | 227 | 327 | +308.4 |
| 2018 | 4,064.6 | 3,908 | 136 | 272 | +92.4 |
| 2019 | 4,718.9 | 3,746 | 130 | 292 | +133.7 |
| 2020 | 4,973.8 | 3,611 | 116 | 251 | +149.6 |
| 2021 | 5,859.5 | 3,492 | 107 | 226 | +394.2 |
| 2022 | 5,028.5 | 3,377 | 75 | 190 | -167.9 |
| 2023 | 5,285.0 | 3,274 | 97 | 200 | -68.2 |
All statistics: link to the “Statistics” page