


Annual statistics
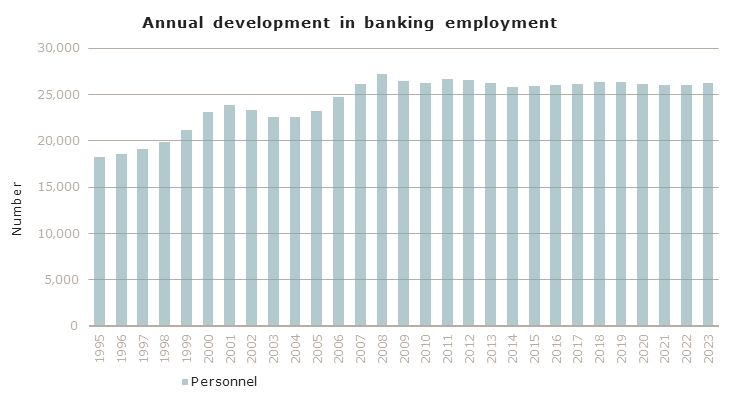
Annual development in banking employment
Situation as at 31 December 2024
| Year End | Number |
| 1992 | 16,143 |
| 1993 | 16,725 |
| 1994 | 17,638 |
| 1995 | 18,283 |
| 1996 | 18,582 |
| 1997 | 19,089 |
| 1998 | 19,834 |
| 1999 | 21,197 |
| 2000 | 23,068 |
| 2001 | 23,886 |
| 2002 | 23,300 |
| 2003 | 22,529 |
| 2004 | 22,554 |
| 2005 | 23,227 |
| 2006 | 24,752 |
| 2007 | 26,140 |
| 2008 | 27,200 |
| 2009 | 26,420 |
| 2010 | 26,254 |
| 2011 | 26,695 |
| 2012 | 26,537 |
| 2013 | 26,237 |
| 2014 | 25,785 |
| 2015 | 25,942 |
| 2016 | 26,060 |
| 2017 | 26,111 |
| 2018 | 26,317 |
| 2019 | 26,337 |
| 2020 | 26,106 |
| 2021 | 25,966 |
| 2022 | 26,012 |
| 2023 | 26,254 |
| 2023 | 26,150 |
The development in employment does not mean a net creation or loss of jobs, but includes tranfers of existing jobs from the non-financial sector to the financial sector, and vice-versa.
All statistics: link to the “Statistics” page